The term “Standard Deviation” comes up quite a lot in research, statistics, and data analysis. But what exactly does tell us, why it is interesting, and how does it work?
The basic idea is fairly simple. You don’t need extensive training in statistics to understand what it means. In fact, I just picked up an old copy of a statistics textbook at a second-hand book shop and it told me everything I needed to know.
Background
One of the most important parts of research and data analysys is that your results and findings can be communicated. However, people are often very busy and don’t have time to sift through every ounce of your data. Anything you can do to help people get a better idea of the shape of your data quickly can be very useful. That’s where things like Standard Deviation (SD) come in handy.
An extreme example
Let’s say you’ve been researching how people’s age affects their musical tastes (we’ll call it Study A). You could say “we conducted a study of 100 people, aged 20 to 70”. Your results might show that 99% of people like hip-hop music. However, somebody else might repeat the experiment (Study B) with another 100 people in the same age range, and find that 99% dislike hip-hop. How could that happen?
Study A could have had 99 people aged 20, and only 1 person aged 70. Meanwhile, Study B could have had 99 people aged 70, and only 1 person aged 20. It’s crucially important that you express any significant bais like that in your data, otherwise you could end up drawing conclusions which nobody can verify or use.
In this case, the age is such an important value that you would probably show a table and/or graph detailing the break-down of ages. However, such detail is not always necessary.
How would Standard Deviation help?
The SD value tells us how dispersed the data is. For example, in the studies above, the data is extremely tightly focused on a single value in each case. Your standard deviation in both instances would be quite low compared to the size of the data range (SD = 5). This would indicate that the data points are tightly clustered.
On its own, this doesn’t say much. However, the SD is based on the mean (average) value. As such, telling readers the mean and the SD would help them understand how much variety there is in your data.
Why not just the mean?
You might be wondering why you don’t just tell people the mean value on its own. It is true that in our two extreme examples above, the mean alone indicates that there is a huge bias at the top or bottom of the range: the means are 20.5 and 69.5 respectively. However, consider two different examples:
Let’s say you conduct Study C with 1 person aged 20, 1 person aged 70, and 98 people aged 45. That puts your mean value right in the middle at 45. Somebody else might repeat your experiment (Study D) with 50 people aged 20, and 50 people aged 70. You’ve both got the exact same age range and mean, but you are probably going to find hugely different results.
In this case, Study C has a standard deviation of roughly 3.6. Study D has an standard deviation of roughly 25.1.
The big difference clearly shows the different shapes of the data sets. The low SD of Study C implies that most almost all of the participants are very close to the mean age. The high SD of Study D implies that most of the participants are very far from the mean age.
Why is it interesting?
Hopefully I have shown above that the standard deviation can be useful for communicating the shape of data. It can help ensure that we don’t misrepresent our data. It can also be used effectively in expressing the results of an experiment.
For example, if your results have a very low SD then it is likely that your results are quite predictable. However, a high SD might suggest that the experiment was quite erratic and that the results may be difficult to reproduce. That depends very much on the context though.
How does it work?
Here’s where the maths comes in. You can perhaps get a clue as to how it works if you know the alternative name: the root mean square deviation.
For a discrete data set X, the Standard Deviation s is given by the equation:
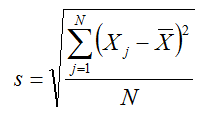
The X with a bar over it is the mean of the data set. It’s worth noting that this is the basic ‘biased’ version of the standard deviation equation. The ‘unbiased’ version divides by “N – 1”.
As you can see, it calculates the square of how far away each value is from the mean (squaring it means that a bigger difference has a bigger effect). It then calculates the mean of all those resulting values, and takes the square root. The square root here simply cancels out the squares we calculated earlier.
And finally…
There are alternatives, although standard deviation is very common. It’s actually expected in many scientific journals that any graphs you provide show the SD. Methods for calculating it will probably be found in any maths/statistics package, so it’s not hard to use.
For example, Excel provides functions called “STDEV()” and “STDEVP()” (unbiased and biased equations respectively) for which you can supply a range of cells containing the values, such as A1:A100.
For more information, check out the Wikipedia article on standard deviation, or look up any decent statistics textbook.